I love charts, and luckily for me, my job at Azara involves creating a lot of charts. The best kinds of charts are those that have multiple story lines and inspire further investigation and thought, and I believe the following two are spectacular because of their simplicity and the story they tell. They are both histograms, which count the frequency of a value in a set of values. In this case, the charts are counting the frequency of a specific systolic/diastolic blood pressure (BP) reading over 33 million blood pressure readings taken across the United States from 1/1/2014 to the present. Their story is one of human biases (or if you are a cynic, human laziness) against a machine’s unyielding consistency.
For those uninitiated to the world of blood pressure, it is measured in millimeters mercury, a unit of pressure (mmHg) and can be taken manually or by a digital device. When a human takes a manual blood pressure, they only report their readings in even increments. When taking a manual blood pressure reading, they are watching the dial on the sphygmomanometer fall as they release the pressure, and waiting to hear two different sounds. The first knocking sound (Korotkoff) is the patient's systolic pressure. When the knocking sound disappears, that is the diastolic pressure (such as 120/80). (more on how to take a manual BP reading). If they are in a hurry, the person taking the reading will release the pressure faster and it will become even harder to get a precise measurement, as the dial will be moving much faster, and it will be harder to read exactly what the dial said when the sounds occurred. A machine doesn’t have any of these issues, and can take a reading down to a precise single digit.
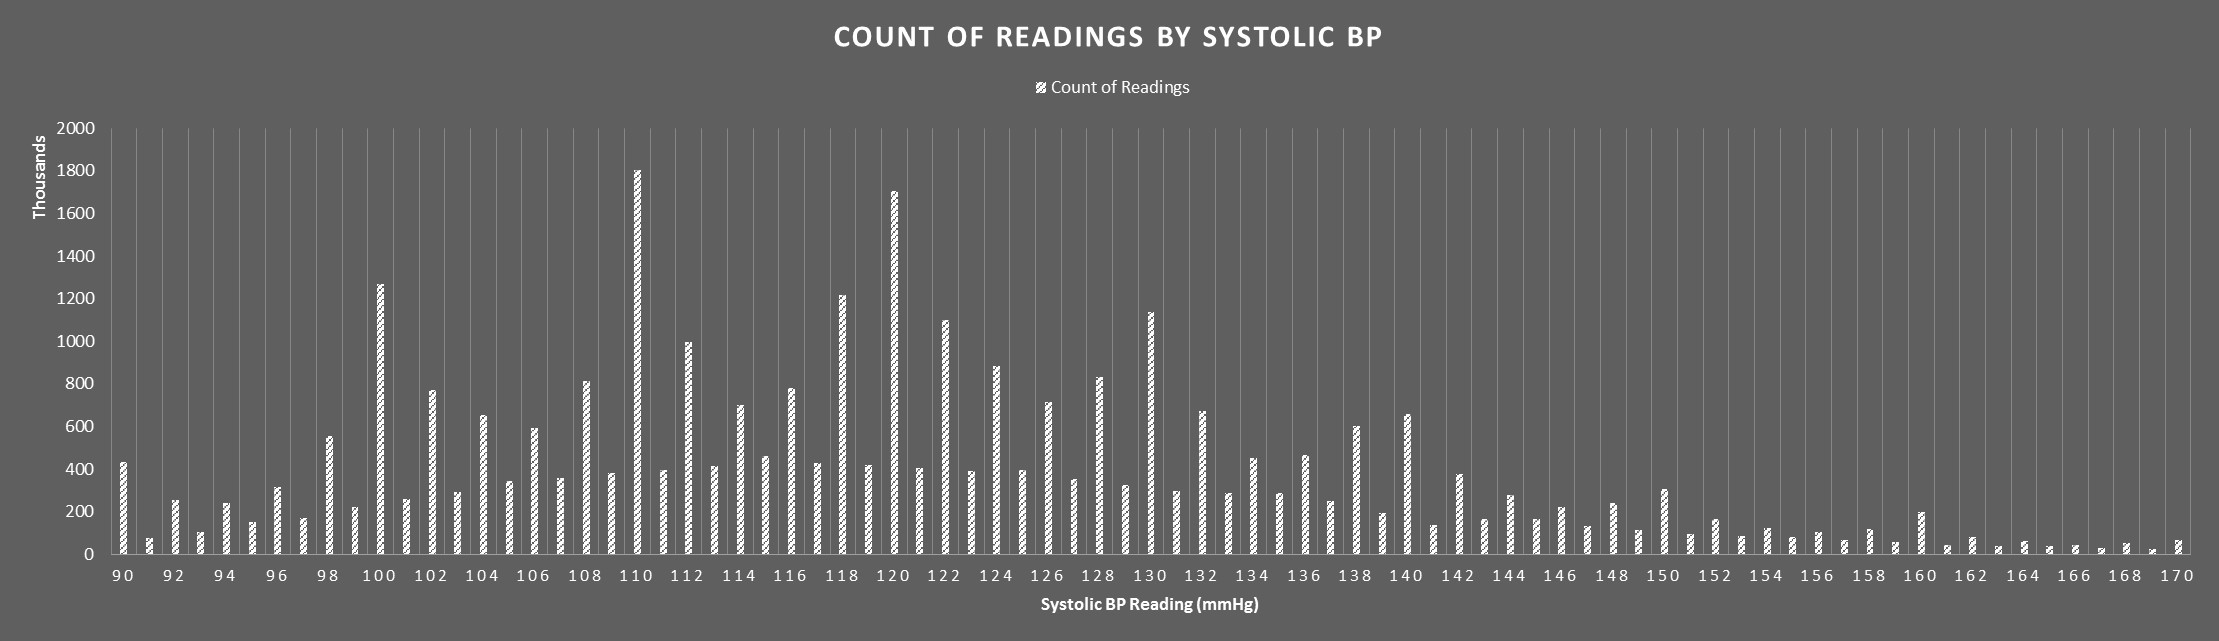
How does this play in to the charts above? We know that manual readings are only recorded in even digits, and we can see that there are large spikes on the even digits of both graphs. This means that most of the even numbered readings were taken by humans. However, we do see readings on odd numbers, so there are definitely machines involved as well. Machines can report in both even and odd numbers, so an even reading can be either machine or human, but an odd reading is almost certainly a machine (or a contrarian human). So, what can we glean from this ability to distinguish between human and machine? To me, the most striking pattern is the giant spikes on multiples of 10. This tells me that humans have an overwhelming bias to report BP results as a multiple of 10. Even further, readings ending in 2 and 8 are also far more likely than readings ending in 4 and 6 (perhaps because 2 and 8 are closer to the 10 and easier to see than in the middle). This shouldn’t be the case, both of these charts should be nice, even, boring, bell curves. As you can see by looking at the odd readings, this nice, boring, bell curve is exactly what the machines produce.
The last interesting tidbit of information we can squeeze out of this chart occurs around the 140 mmHg mark on the systolic chart, and the 90 mmHg mark on the diastolic chart. While there are various thresholds for high blood pressure , a systolic reading of 140 mmHg or higher OR a diastolic reading of 90 mmHg or higher is the standard used to define stage 1 hypertension in clinical quality measures. As you can see, the reading ending in 8 directly preceding these thresholds (138 mmHg systolic or 88 mmHg diastolic) has only a slightly smaller incidence rate that the threshold itself. Even further, the reading ending in 2 directly after the reading has a smaller incidence rate than expected, at least as expected based on the pattern of the chart (admittedly, this is more prevalent in the diastolic chart). Most medical professionals qualified to take a blood pressure reading would know these thresholds, so my best assumption is that the thresholds’ presence has caused them to act differently and record a slightly lower reading despite best practice which would indicate that one records the higher reading
Does this even matter though? I frankly do not know and I am not qualified to say if a BP reading that is off by 4 mmHg or so in either direction would affect a patient’s care significantly. I will leave that interpretation to the medical professionals. The purpose of this blog is merely to bring to light an interesting and unexpected pattern and to let you draw your own conclusions. The next time you go to the doctor and they tell you your BP is exactly 120/80, you might want to have them check again.
Want to learn how Azara can help your organization meet it’s population health and value-based care goals? Contact solutions@azarahealthcare.com or request a demo now.
Related Articles

Navigating the Social Care Landscape: Five Lightbulb Moments from the SIREN National Research Meeting
Explore Insights
Bridging the Gap in Veteran Healthcare: The Vital Role of Federally Qualified Health Centers in Supporting Our Heroes
Explore Insights