Recently, Janette Keddy, Azara’s Director of Client Success, shared the article Algorithms of Inequality1 with our team. The article explains that, in the face of unprecedented shortages of life-saving equipment, states are turning to data-fueled algorithms to help healthcare workers make impossible decisions about which patients to save. The idea of an algorithm is comforting on the surface; having a computer make the decisions rather than a person seems easier, especially when that decision is literally between life and death. But as the article points out, any algorithm that is programmed to identify “sicker” patients, who therefore may be less worth saving, is going to net you a lot of people with existing chronic conditions. And as anyone who has worked in a community healthcare setting knows only too well, patients of color tend to have higher rates of chronic conditions like hypertension, diabetes, kidney disease, and the list goes on.
Through the course of this pandemic we have also seen that communities of color are being hit harder by the Coronavirus. Azara clients are unsurprised by this; every center I have worked with who takes even a cursory glance at their data and groups by race and lab result can see how disproportionately African American patients are testing positive (see bottom of this article for examples of DRVS COVID reporting). So if we follow this reasoning to its logical conclusion, we discover what has been obvious to CHCs from the start; non-white, lower income, marginalized communities (who often make up the majority of an FQHC’s patient population) are not only getting the Coronavirus at higher rates, but are also being denied the life-saving care they need in a perverse cycle that only ends with more of these patients dying.
It is easy to pin the blame on the algorithm. In the article cited above, Pria Anand asserts that, “Besides diluting responsibility for outcomes, these tools [algorithms] foster the perception of impartiality based on the illusion that they are not subject to the same biases as human beings.” But condemning both the use of algorithms in general along with their specific failings seems like as much of a cop-out as leaving life-changing decisions to these algorithms to begin with.
Algorithms do what we tell them to do – the inherent biases in an algorithm come from those of the humans who design it, or in this case, the structural biases embedded in our society. The healthcare landscape as we know it does not make creating an impartial algorithm easy, or even possible, and we are restricted to using whatever data we do have. When evaluating algorithms like the ones in the aforementioned article, we must practically assess what we can reasonably expect from such a program. Calculating who lives and dies will always be an exercise fraught with peril, as any data that feeds such a calculation is inevitably laden with the socioeconomic weight of the people providing it.
Calculating who lives and dies will always be an exercise fraught with peril, as any data that feeds such a calculation is inevitably laden with the socioeconomic weight of the people providing it.
So rather than condemn algorithms, I believe we must critically examine those we do use, in the context of where we get the data to feed them. A perfect example of this is risk scoring. There have been a variety of studies illuminating just how racially biased commercial, claims-based risk algorithms are, including this one2 from October 2019. In a nutshell, these studies point out that because lower income patients of color go to the doctor less regularly than more affluent, typically white patients, they have fewer claims from which to draw data that would contribute to a potentially higher risk score.
Risk scores are used in a variety of ways, but of note here are the financial and care delivery impacts. Many payers will allocate more money to healthcare entities with higher aggregate risk scores across their patient population, and providers will use their risk algorithm to identify patients who need extra support and attention. Between these two factors, we can conclude that if you do not go to the doctor regularly, you as a patient will not contribute to more funding for your healthcare provider, and will also not be included in a high-risk list that might get you the additional resources you need to improve your overall health. Combining this finding with the earlier discussion about algorithms employed in this time of a pandemic, we reach the disturbing conclusion that patients who are lower income, marginalized, and often of color, get the short end of the stick in both good times and bad.
Once you start to peel back the layers of inequality that are built into so many systems of decision making, it can seem hopeless to rely on data that is so skewed from the outset. But I do believe in data and the opportunities it affords. What I try to focus on is how we can make these data solutions more equitable, and a few things come to mind:
First, Azara’s risk algorithm. We primarily use EHR data, not claims, so patients are included even if they are uninsured or have only had limited interactions with a healthcare provider. The algorithm is also flexible and transparent, allowing centers to more heavily weigh certain risk criteria depending on the specific make-up of the community. The Azara algorithm does not generate a multi-decimal place score purporting to be so specific as to replace clinical decision making. Our algorithm is designed to help you find patients who need extra support if they meet any number of criteria (all of which you can conveniently see on the Patient Risk Stratification dashboard in DRVS), and then leave the decisions about what that support looks like to clinicians. Any risk algorithm will never be perfect though; no computer can solve such a complex and multi-layered problem, and claims-based methods do have some advantages. The key takeaway here is that more timely and comprehensive data entry for all patients, not just those with insurance, will always improve any methodology.
Second, social determinants of health reporting. I have mentioned several times throughout this post that lower income patients of color tend to go to the doctor less frequently than more affluent, typically white patients. The reasons for this are complex and thoroughly baked into both the healthcare, socioeconomic, and cultural fabric of the United States. There is no one size fits all answer for how to address the overwhelming disparities from which this situation has resulted; however, to help myself cope with the magnitude of the problem, I once again find myself turning to data.
Social Determinants of Health is a term that has inched further and further into the general public’s consciousness, but one that FQHCs and community healthcare providers have been grappling with forever. Patients who live in food deserts, who cannot afford reliable housing with electricity, who work multiple jobs just to pay the bills and have no time to go to a doctor, are going to have worse health outcomes. It is not a complicated concept to grasp but is infinitely complicated to address. Where providers can start though is trying to understand the scope of the problem for their patients. In DRVS, for example, centers with a standardized SDOH screening tool like PRAPARE, can start to identify SDOH patterns in their community. We know a patient who is on welfare and lives 25 miles away from the health center will have trouble making their appointment; but does the provider even know that patient has those concerns? You cannot fix what you cannot see and integrating SDOH and clinical data is a first step to understanding what the problems even are.
You cannot fix what you cannot see and integrating SDOH and clinical data is a first step to understanding what the problems even are.
Finally, the way I think we can best help even the scales is continuing to support and invest in you, Azara’s clients. No matter how much data we have and how sophisticated our modeling and algorithms get, it is the work CHCs do every day that makes me most hopeful for the future. You treat patients who do not have insurance, who are impoverished and marginalized. You see these patients in a way claims-based risk algorithms and private healthcare facilities do not. You bring to light the inequalities that are so entrenched across our country and face them head on. By offering services to the patients who are ignored by so many systems in times both good and bad, you make a real difference. Azara is lucky to serve such a dedicated, compassionate corner of the healthcare space. We rely on algorithms and logic as much as any other healthcare analytics vendor or payer; however, we believe it is the data we use, provided by our amazing clients, that help make our solutions more equitable. In turn, it is our sincere hope that this data can be put to good use to inform broader change and remind all healthcare providers that there is always more to see.
We thank our clients for their work, in this pandemic and always, and for never turning away those who are so often unrecognized. You all help right the inequalities that can seem so intractable, and for me, it lightens my heart to know there are those who will never stop making a difference.
DRVS Tools
DRVS COVID-19 Race Disparities Dashboard
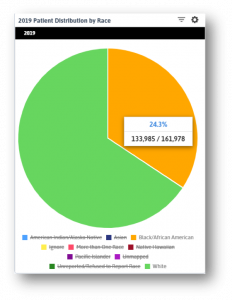
These widgets show the breakdown of patients in this state by race for the year 2019 (left) and the racial breakdown of positive COVID patients (below). African American patients make up roughly a quarter of all patients (I restricted the data to only White and African American patients as other racial groups make up less than 15% of all patients) but over half of all positive tests.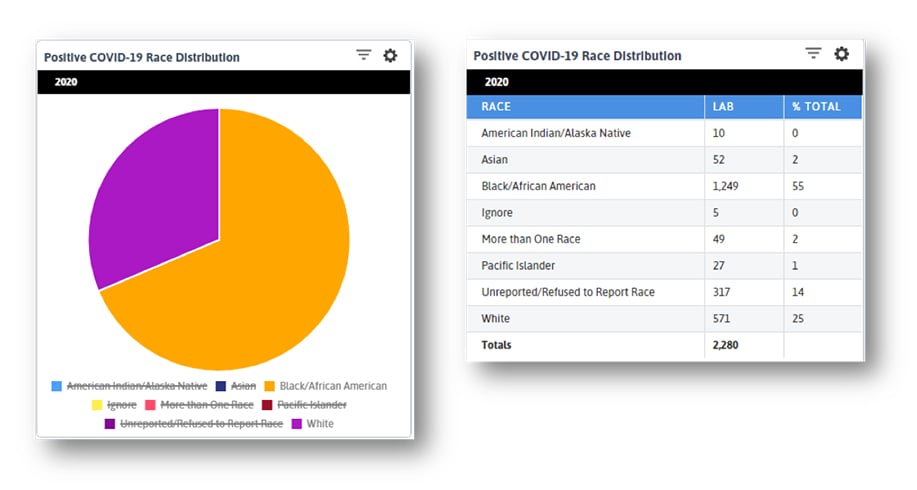 What we see below is that while overall visit numbers are declining (FQHCs provide mostly primary care services that are being put on hold with the pandemic) and telehealth visits are increasing, the latter is not doing so equally. The curve for White patients is significantly steeper than that of African American or Asian patients. When we consider how patients of color face barriers to amenities like stable internet, home computers, and housing, what we see here is unsurprising. What I take from this trendline is that centers can continue to do what they always have: reach out to lower income, isolated, marginalized patients to make sure they do not get left behind.
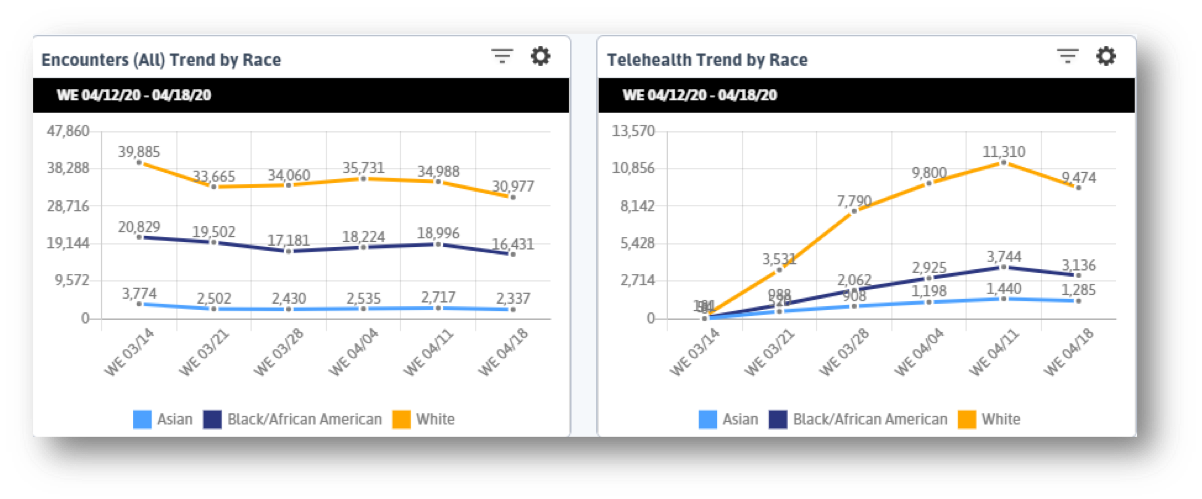
Log in to DRVS to explore your own state or center’s data, and stay tuned for Azara’s next video where we dive deeper into the Racial Disparities dashboard with Emily Holzman and Greg Augustine.